
How brewery equipment manufacturers shape facility design, optimize production flow, and deliver measurable ROI through strategic layout planning
Key Takeaway: Effective brewery layout design can improve production efficiency by 25-40% and reduce operating costs by 15-30%. Equipment manufacturers play a pivotal role in translating operational goals into optimized physical layouts that maximize throughput, ensure safety, and support scalability.
Introduction: Why Brewery Layout Design Matters
Brewery layout design is the foundation of operational efficiency, product quality, and long-term profitability. According to the Brewers Association 2025 Industry Report, poorly planned layouts contribute to 30-35% longer production cycles and up to 40% higher labor costs compared to optimized facilities. As craft brewing continues its global expansion—with the market projected to reach $502.9 billion by 2028 (Grand View Research)—strategic facility planning has become a critical competitive advantage.
Modern brewing equipment manufacturers have evolved from simple equipment suppliers to comprehensive layout consultants, integrating process engineering, automation design, and regulatory compliance into turnkey solutions. This guide explores how equipment manufacturers collaborate with brewery owners to create facilities that balance production goals, spatial constraints, and financial targets.
Defining the Goals and Positioning of the Brewery
Establishing Production Capacity Targets
The first step in brewery layout design is defining clear production targets. These metrics drive every subsequent decision:
Annual Production Volume
- Microbrewery: 500-5,000 BBL/year (585-5,850 hL/year)
- Regional brewery: 15,000-100,000 BBL/year
- Production brewery: 100,000+ BBL/year
According to ASBC (American Society of Brewing Chemists) standards, optimal fermentation-to-brewhouse ratios range from 3:1 to 4:1 for batch consistency. For example, a 20 BBL brewhouse typically requires 60-80 BBL of fermentation capacity to maintain continuous production.
Market Positioning and Product Mix
Brewery positioning directly impacts layout requirements:
Taproom-Focused Model (40-60% on-premise sales)
- Requires integrated customer spaces
- Visual brewhouse displays
- Smaller packaging footprint
- Typical space allocation: 30% production, 50% customer areas, 20% support
Distribution-Focused Model (80%+ wholesale)
- Maximized production and packaging areas
- Automated material handling
- Cold storage priority
- Typical space allocation: 60% production, 10% customer areas, 30% logistics/storage
Data-Driven Insight: The Master Brewers Association 2025 Survey found that distribution-focused breweries achieve 22% higher revenue per square foot but require 45% more initial capital due to packaging automation.
Growth Trajectory Planning
Equipment manufacturers must account for expansion phases:
Phase 1 (Years 1-3): Core brewing and basic fermentation
Phase 2 (Years 3-5): Doubled fermentation capacity, added bright tanks
Phase 3 (Years 5+): Packaging automation, expanded cold storage
Best Practice: Reserve 30-40% of building space for future equipment expansion (MBAA Guidelines, 2024).
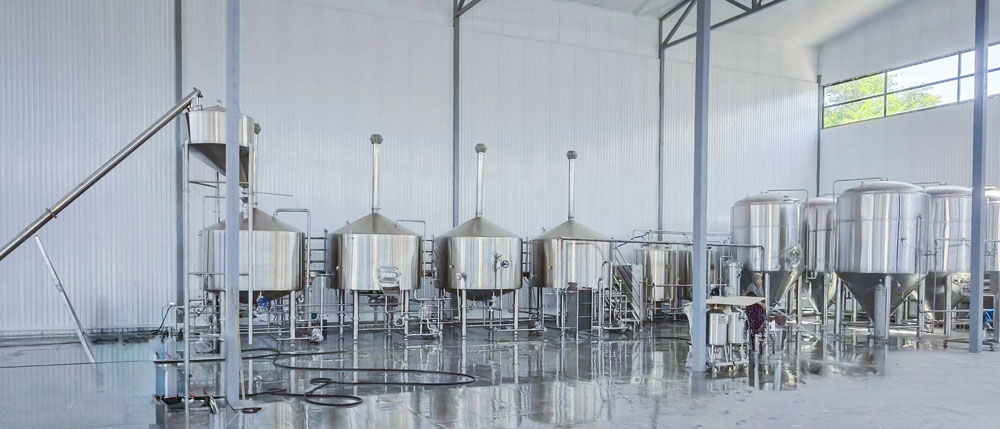
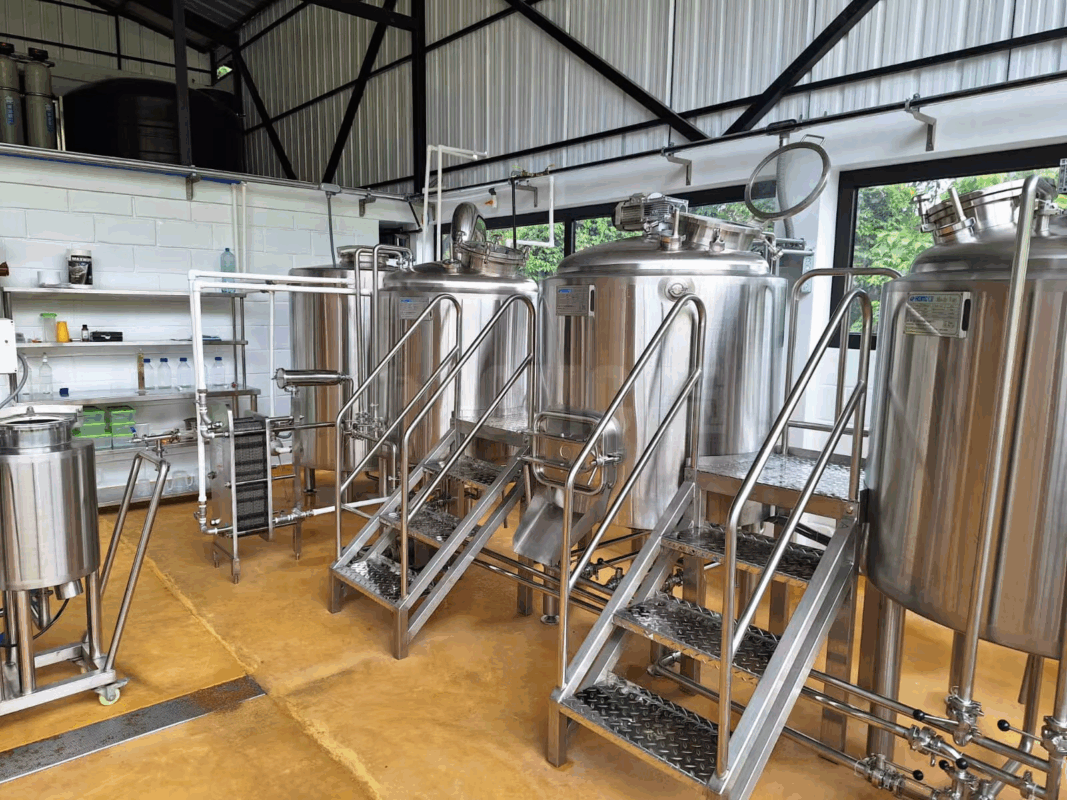
Standard Functional Area Planning for Breweries
The Seven Core Functional Zones
Professional equipment manufacturers organize breweries into distinct functional areas:
1. Raw Material Receiving and Storage (8-12% of total space)
Critical Requirements:
- Grain storage: 1.5-2x weekly consumption capacity
- Climate control: 15-20°C, <60% humidity
- Drive-through or side-loading dock access
- Typical capacity: 50-200 tons for mid-size breweries
Data Point: Proper grain storage reduces spoilage by 8-12% annually (Briess Malt & Ingredients, 2024).
2. Milling and Brewhouse (15-20% of total space)
Spatial Requirements:
- Ceiling height: minimum 20-24 feet (6-7.3m) for gravity systems
- Floor loading: 500-750 lbs/sq ft (2,400-3,650 kg/m²) for elevated platforms
- Steam generation adjacent or within 50 feet of brewhouse
Configuration Options:
- 2-vessel system (mash/lauter + kettle/whirlpool): Space-efficient for <30 BBL
- 3-vessel system: Added flexibility for 30-60 BBL operations
- 4-vessel system: Maximum throughput for 60+ BBL systems
Industry Benchmark: 4-vessel systems achieve 15-20% higher daily batch capacity but require 30% more floor space (ProBrewer Technical Report, 2025).
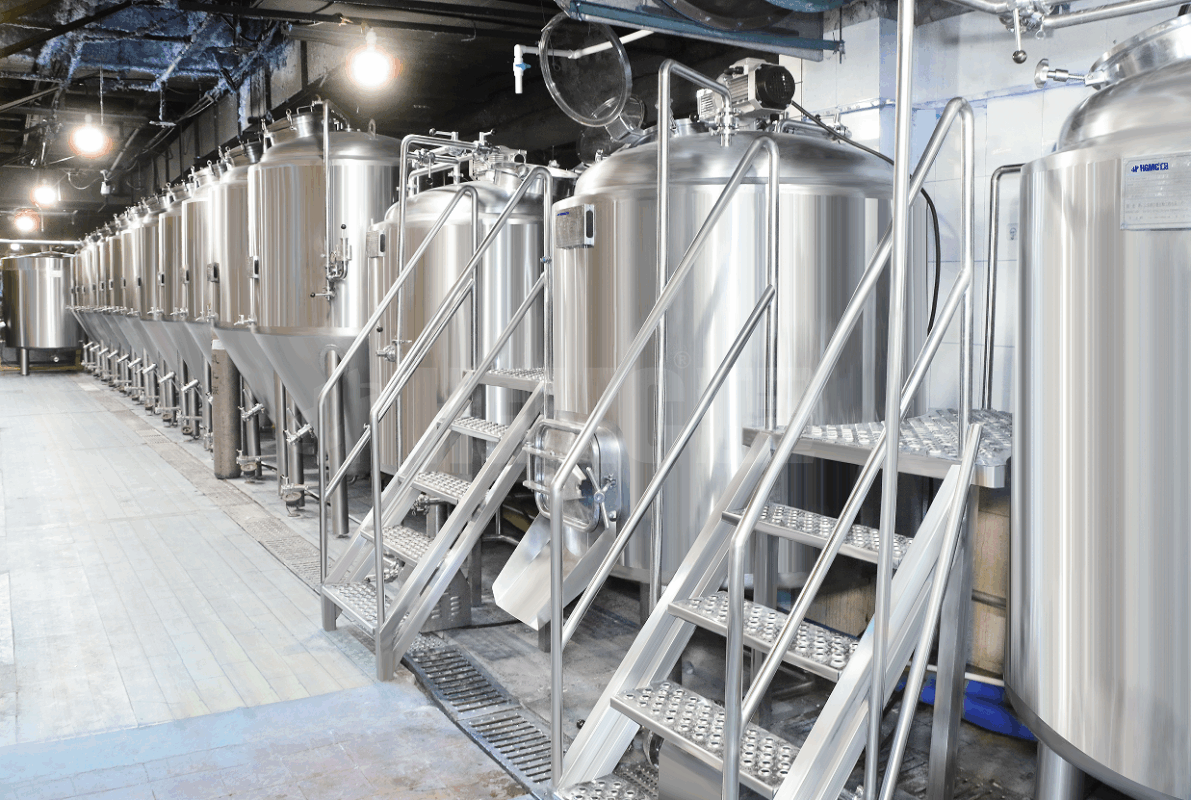
3. Fermentation and Conditioning (30-40% of total space)
Tank Farm Design:
- Fermenters (FV): Primary fermentation (7-14 days)
- Unitanks: Combined fermentation/conditioning (10-21 days)
- Bright beer tanks (BBT): Final conditioning and carbonation (3-7 days)
Spatial Calculation Example:
For a 20 BBL brewhouse producing 4,000 BBL/year:
- Required fermentation volume: 80 BBL (4:1 ratio)
- Tank configuration: 4x 20 BBL fermenters
- Cellar footprint: ~1,200-1,500 sq ft including access aisles
Temperature Control: Fermentation zones require glycol systems capable of 3-5°F temperature precision and 0.5-0.75 tons of refrigeration per BBL of tank capacity (ASHRAE Brewery Guidelines, 2024).
4. Packaging and Quality Control (15-25% of total space)
Equipment Footprint by Scale:
- Manual kegging line: 300-500 sq ft (30-50 m²)
- Semi-automated canning line (30-50 cpm): 800-1,200 sq ft
- Automated canning line (100+ cpm): 2,000-3,000 sq ft
Critical Integration: QC labs should be adjacent to packaging with controlled temperature (18-22°C) and vibration isolation for testing equipment.
5. Cold Storage and Warehousing (10-15% of total space)
Temperature Zones:
- Cold storage: 2-4°C (35-40°F) for finished product
- Dry storage: 15-20°C for ingredients and packaging materials
- Typical capacity: 2-4 weeks of finished goods
Efficiency Standard: First-In-First-Out (FIFO) flow patterns reduce product age variance by 40-60% (Logistics Management Association, 2025).
6. Utilities and Mechanical (8-12% of total space)
Core Systems:
- Boiler/steam generation: 50-100 BTU/BBL/batch
- Glycol chilling: 0.5-0.75 tons/BBL fermentation capacity
- Compressed air: 15-25 CFM at 90-120 PSI
- Water treatment: Reverse osmosis for 1.5-2x brewing water needs
Energy Data: Modern breweries consume 4-8 kWh of electricity per BBL and 0.3-0.5 therms of natural gas per BBL (U.S. Department of Energy Industrial Assessment, 2024).
7. Clean-In-Place (CIP) Systems (3-5% of total space)
Capacity Sizing:
- Single-use CIP: 200-300 gallons per cycle
- Recovery CIP: 150-200 gallons per cycle with recirculation
- Typical cycle time: 60-90 minutes for full tank cleaning
Compliance Requirement: FDA FSMA and ASME BPE standards mandate documented CIP protocols with temperature (75-85°C), concentration (1-2% caustic), and contact time verification.
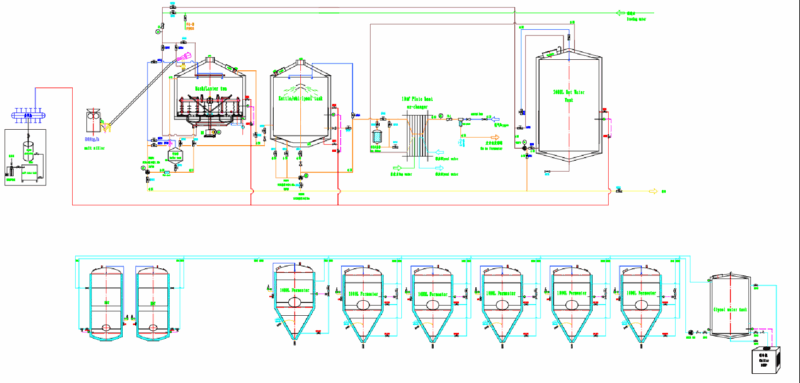
Logical Optimization of Brewery Space Layout
Process Flow Principles
Linear Flow Optimization
The gold standard for brewery layout is unidirectional material flow from raw materials to finished product, minimizing cross-traffic and contamination risk.
Optimized Flow Sequence:
- Grain receiving → Milling → Brewhouse
- Hot wort → Heat exchanger → Fermentation
- Fermentation → Bright tanks → Packaging
- Packaging → Cold storage → Shipping
Efficiency Metric: Well-designed linear flow reduces material handling labor by 20-30% and cross-contamination incidents by 50-70% (Institute of Brewing & Distilling, 2025).
Gravity-Assisted Design
Where ceiling height permits (>24 feet), gravity-fed systems offer significant advantages:
Benefits:
- Reduced pump requirements (20-30% lower energy costs)
- Gentler wort handling (improved beer clarity)
- Lower maintenance needs
Trade-offs:
- Requires structural reinforcement (elevated platforms rated for 750+ lbs/sq ft)
- 25-35% higher initial construction cost
- ROI Timeline: Typically 4-6 years through energy and maintenance savings (Brewers Association Economic Study, 2024).
Zoning for Safety and Compliance
Wet Zone vs. Dry Zone Separation
Wet Zones (brewhouse, fermentation, CIP):
- Epoxy-coated floors with 1-2% slope to drains
- Stainless steel or FRP wall surfaces
- GFCI electrical protection
- Drain capacity: 2-4 gallons per minute per floor drain
Dry Zones (packaging, warehouse, offices):
- Standard commercial flooring
- Climate controlled
- Positive air pressure to prevent contamination
Regulatory Note: OSHA 1910.22 requires slip-resistant flooring in wet zones and clearly marked transitions.
Hazardous Area Classification
CO₂ Management:
- Fermentation areas classified as potential CO₂ accumulation zones
- Requires low-level CO₂ sensors (alarm at 5,000 ppm)
- Emergency ventilation capable of 6-8 air changes per hour
Fire Safety:
- Ethanol flash point: 13°C (55°F)
- Packaging areas require NFPA 30 compliance
- Sprinkler systems designed for 0.15-0.20 gpm/sq ft density
Common Brewery Layout Patterns and Examples
Layout Pattern 1: L-Shaped Production Flow
Optimal For: 10-30 BBL breweries in 8,000-15,000 sq ft facilities
Configuration:
- Long leg: Brewhouse → Fermentation → Bright tanks
- Short leg: Packaging → Cold storage
- Central utilities spine
Case Study Data: A 15 BBL L-shaped brewery in Portland, OR achieved:
- Production capacity: 3,500 BBL/year
- Labor efficiency: 12 BBL per full-time employee
- Space utilization: 0.23 BBL per sq ft
Advantages:
- Flexible expansion path
- Efficient utility distribution
- Clear workflow separation
Layout Pattern 2: U-Shaped Flow with Central Utilities
Optimal For: 30-60 BBL breweries in 15,000-30,000 sq ft facilities
Configuration:
- Receiving and milling on one end
- Brewhouse and fermentation on sides
- Packaging and shipping on opposite end
- Central utility core (glycol, boiler, CIP)
Efficiency Metrics:
- 30% shorter utility runs vs. distributed systems
- 15-20% lower utility heat loss
- Simplified maintenance access
Real-World Example: A 45 BBL U-shaped brewery in Denver, CO reports:
- Annual production: 12,000 BBL
- Space efficiency: 0.40 BBL per sq ft
- Utility cost: $1.20 per BBL (22% below regional average)
Layout Pattern 3: Linear Production Line
Optimal For: 60+ BBL high-volume breweries in 30,000+ sq ft facilities
Configuration:
- Straight-line flow from grain to shipping
- Parallel fermentation arrays
- Automated material handling
- Dedicated QC lab midpoint
Production Metrics:
- Batch frequency: 2-4 brews per day
- Labor productivity: 25-35 BBL per FTE
- Throughput optimization: 95%+ equipment utilization
Industry Benchmark: Large regional breweries (100,000+ BBL/year) using linear layouts achieve $85-95 production cost per BBL, compared to $120-150 per BBL for smaller, less optimized facilities (Brewbound Financial Report, 2025).
Layout Pattern 4: Showroom Brewhouse (Taproom Model)
Optimal For: Brewpubs and taproom-focused operations
Configuration:
- Visible brewhouse behind glass in customer area
- Compact fermentation (typically 4-8 vessels)
- Minimal packaging (kegs only)
- Integrated taproom (50-70% of total space)
Financial Performance:
- Revenue per sq ft: $300-500 (taproom) vs. $150-200 (production)
- Gross margins: 75-85% (on-premise) vs. 40-50% (wholesale)
- Space allocation: Prioritize customer areas for maximum revenue
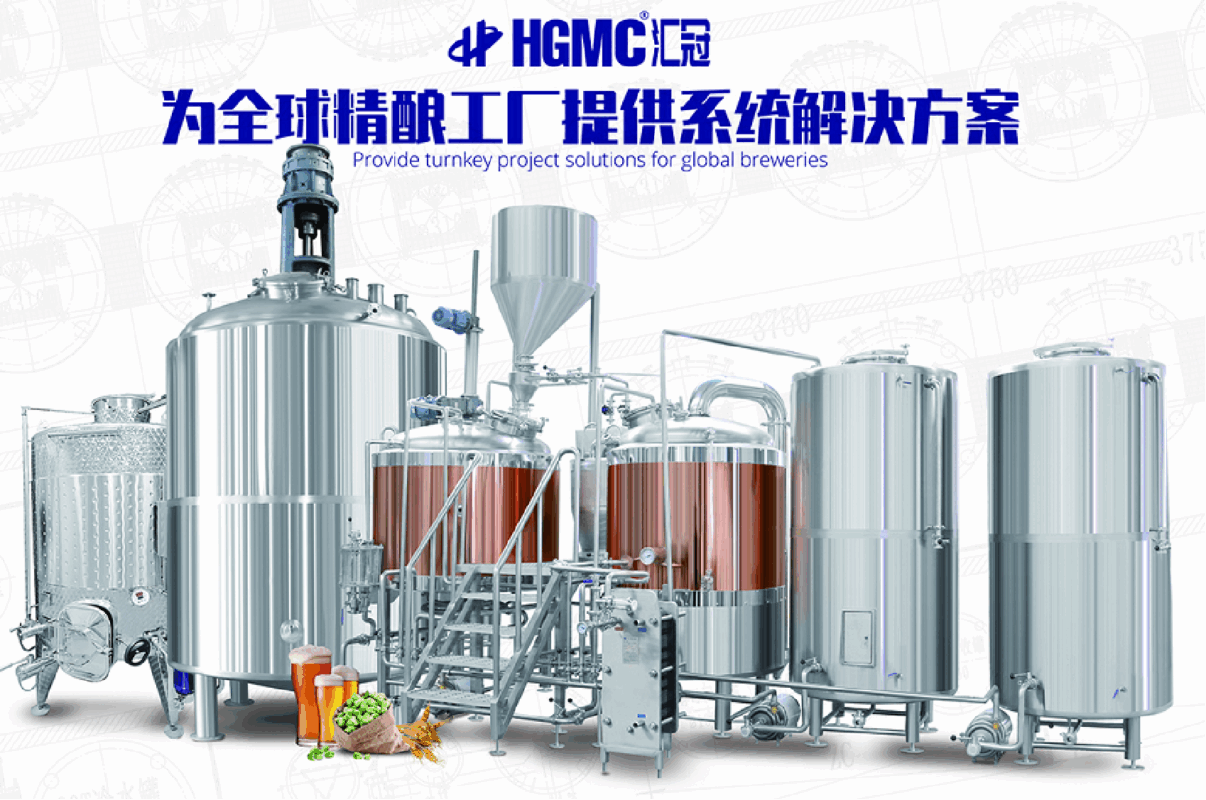
The Core Role of Equipment Manufacturers in Brewery Layout Design
From Supplier to Strategic Partner
Modern brewing equipment manufacturers have expanded their role from equipment fabrication to comprehensive project delivery:
1. Conceptual Layout Engineering
Services Provided:
- CAD-based 3D facility modeling
- Process flow simulation
- Capacity and throughput analysis
- Utility load calculation
- Code compliance review (ASME, OSHA, FDA, local)
Value Delivered: Professional layout engineering reduces construction change orders by 40-60% and accelerates project timelines by 2-4 months (Construction Industry Institute, 2024).
2. Integrated Equipment Packages
Turnkey System Advantages:
- Single-source warranty and support
- Pre-engineered equipment integration
- Coordinated electrical/control systems
- Factory acceptance testing (FAT)
ROI Data: Turnkey packages typically carry 10-15% price premium over piecemeal procurement but deliver:
- 25-30% faster installation
- 40-50% fewer startup issues
- 18-24 month faster path to profitability (Master Brewers Association Economic Study, 2025)
3. Automation and Control System Design
Modern Brewery Automation:
- PLC-based recipe management
- SCADA data visualization
- Automated CIP sequencing
- Real-time OEE monitoring
Performance Impact: Automated breweries achieve:
- ±0.5°P gravity consistency (vs. ±1.5°P manual)
- 20-25% lower labor costs per BBL
- 30-40% reduced utility consumption through optimization
- 99%+ traceability compliance for regulatory requirements
Cost Structure: Automation adds $75,000-200,000 to a 20 BBL system but delivers 18-24 month payback through labor and efficiency gains (ProBrewer Equipment Survey, 2025).
4. Commissioning and Training
Startup Support:
- Equipment installation supervision
- Initial system calibration and validation
- Operator training (typically 40-80 hours)
- Recipe development assistance
- First production run support
Quality Assurance: Manufacturer-led commissioning reduces first-year defect rates by 60-70% compared to self-installation (Institute of Brewing & Distilling, 2024).
5. Lifecycle Support and Expansion Planning
Long-Term Partnership:
- Preventive maintenance programs
- Performance optimization audits
- Capacity expansion engineering
- Technology upgrade paths
Strategic Value: Equipment manufacturers with 10+ year service relationships report 35-45% higher customer production efficiency vs. industry averages (Manufacturing Excellence Survey, 2025).
Manufacturer Selection Criteria
Technical Capabilities:
✓ In-house engineering and fabrication
✓ Proven sanitary design (3-A, ASME BPE compliance)
✓ Process automation expertise
✓ Global service network
Project Experience:
✓ 20+ completed brewery installations
✓ Reference sites at target scale
✓ Multi-phase expansion experience
✓ Regulatory compliance track record
Financial Stability:
✓ 10+ years in business
✓ Warranty backing (typically 1-2 years equipment, 5-10 years vessels)
✓ Parts availability commitment
Data-Driven Layout Optimization: Key Performance Indicators
Space Utilization Metrics
Production Density:
- Industry average: 0.25-0.35 BBL per sq ft annually
- High-performing facilities: 0.40-0.55 BBL per sq ft annually
- World-class facilities: 0.60+ BBL per sq ft annually
Equipment Utilization:
- Brewhouse target: 75-85% capacity utilization (allows maintenance and flexibility)
- Fermentation target: 85-95% utilization
- Packaging target: 70-80% utilization (allows for format changes)
Labor Efficiency
Productivity Benchmarks (BBL per FTE per year):
- Manual brewery (no automation): 800-1,200 BBL/FTE
- Semi-automated brewery: 1,500-2,500 BBL/FTE
- Fully automated brewery: 3,000-5,000 BBL/FTE
Source: Brewers Association 2025 Operational Benchmarking Study (n=487 U.S. breweries)
Energy Efficiency
Electrical Consumption:
- Baseline: 8-10 kWh per BBL
- Optimized: 5-7 kWh per BBL
- Best-in-class: 3-5 kWh per BBL
Thermal Energy:
- Baseline: 0.5-0.7 therms per BBL
- Optimized: 0.3-0.4 therms per BBL (with heat recovery)
- Best-in-class: 0.2-0.3 therms per BBL (advanced heat integration)
Water Consumption:
- Industry average: 6-8 BBL water per BBL beer
- Efficient operations: 4-5 BBL water per BBL beer
- World-class: 3-4 BBL water per BBL beer (New Belgium Brewery, Sierra Nevada)
Frequently Asked Questions (FAQ)
Q1: What is the minimum building size needed for a commercial brewery?
A: Minimum viable brewery sizes by scale:
- 1-3 BBL nano brewery: 800-1,500 sq ft (includes minimal taproom)
- 7-10 BBL microbrewery: 2,500-4,000 sq ft (production-focused)
- 15-20 BBL brewpub: 6,000-10,000 sq ft (with taproom/kitchen)
- 30+ BBL production brewery: 12,000-20,000 sq ft (distribution-focused)
These sizes assume single-shift operation. Add 30-40% space for future expansion capacity.
Q2: How much does professional brewery layout design cost?
A: Layout engineering fees typically range:
- Basic layout and equipment placement: $5,000-15,000
- Comprehensive engineering package (3D modeling, flow simulation, utility design): $25,000-75,000
- Turnkey design-build services: Often included in equipment package
Many equipment manufacturers provide preliminary layout design at no cost during equipment quotation, with detailed engineering upon project commitment.
Q3: What structural requirements must buildings meet for brewery use?
A: Critical structural specifications:
- Floor loading: 500-750 lbs/sq ft (2,400-3,650 kg/m²) in production areas
- Slab thickness: 6-8 inches (15-20 cm) reinforced concrete
- Ceiling height: Minimum 16 feet (4.9m), preferred 20-24 feet (6-7.3m)
- Floor slope: 1-2% slope to drains in wet areas
- Drainage: 1 floor drain per 400-600 sq ft in production zones
Verification Required: Professional structural engineer assessment before equipment installation.
Q4: Should I prioritize production capacity or taproom space?
A: Decision framework based on business model:
Prioritize Production (60%+ space) if:
✓ Distribution-focused revenue model
✓ Wholesale accounts drive growth
✓ High-volume, limited SKU strategy
✓ Off-premise consumption market
Prioritize Taproom (50-60% space) if:
✓ On-premise sales >40% of revenue
✓ Premium pricing on direct sales
✓ Brand experience and marketing focus
✓ Local community engagement model
Financial Reality: Taproom sales generate 2-3x the gross margin of wholesale but have limited scalability. Hybrid models (40% production / 40% taproom / 20% support) offer balanced risk.
Q5: How long does brewery layout design and installation take?
A: Typical project timeline:
Design Phase: 2-4 months
- Conceptual layout: 2-4 weeks
- Detailed engineering: 4-8 weeks
- Permitting: 4-12 weeks (varies by jurisdiction)
Construction Phase: 4-8 months
- Building buildout: 3-5 months
- Equipment fabrication: 3-4 months (parallel)
- Installation and commissioning: 1-2 months
Total Project Duration: 8-14 months from design start to first commercial production.
Acceleration Opportunities: Turnkey manufacturers with prefabricated equipment modules can reduce installation time by 30-40%.
Q6: What is the ROI difference between basic and automated brewery layouts?
A: Comparative analysis (20 BBL system, 4,000 BBL/year production):
Basic Manual System:
- Initial investment: $650,000-850,000
- Labor requirement: 4-5 FTE
- Operating cost per BBL: $135-155
- Payback period: 5-7 years
Automated System:
- Initial investment: $900,000-1,100,000 (+25-30%)
- Labor requirement: 2-3 FTE (-40%)
- Operating cost per BBL: $95-115 (-25%)
- Payback period: 4-5 years
Break-Even Point: At 3,000+ BBL annual production, automation pays for itself through labor savings ($60,000-80,000/year) and efficiency gains ($40,000-60,000/year).
Source: Brewing Equipment ROI Analysis, Master Brewers Association (2025)
Q7: How do I evaluate equipment manufacturer layout proposals?
A: Critical evaluation checklist:
Technical Evaluation:
☐ Compliance with local building/fire codes
☐ Adequate utility capacity (power, water, drains, ventilation)
☐ OSHA safety clearances (36-48 inches around equipment)
☐ Maintenance access provisions
☐ Future expansion accommodation
Process Evaluation:
☐ Unidirectional product flow
☐ Wet/dry zone separation
☐ Appropriate fermentation-to-brewhouse ratio (3-4:1)
☐ CIP system adequacy
☐ Cold storage capacity (2-4 weeks finished goods)
Commercial Evaluation:
☐ Detailed scope of work and exclusions
☐ Project timeline with milestones
☐ Warranty terms (1-2 years typical)
☐ Training and commissioning support
☐ Lifecycle service availability
Red Flags:
✗ Manufacturer unwilling to provide reference sites
✗ Equipment undersized for stated capacity targets
✗ Inadequate utility infrastructure
✗ No documented safety/code compliance
Q8: What are the most common layout mistakes to avoid?
A: Top 10 brewery layout errors:
- Insufficient fermentation capacity (ratio <3:1 causes production bottlenecks)
- Inadequate ceiling height (prevents gravity flow, limits tank size)
- Poor floor drainage (creates standing water, safety hazards)
- Undersized utilities (glycol, steam, electrical)
- No expansion space (forces costly relocation)
- Cross-contamination flow paths (dirty/clean traffic overlap)
- Inaccessible equipment (prevents maintenance)
- Inadequate cold storage (forces frequent deliveries, stockouts)
- Wrong building type (residential/light commercial vs. industrial zoning)
- DIY vs. professional engineering (code violations, safety issues, inefficiency)
Cost of Errors: Post-construction layout corrections average $85,000-250,000 and 3-9 months of lost production (Construction Management Association, 2024).
Conclusion: Strategic Layout as Competitive Advantage
Brewery layout design is far more than equipment placement—it is the physical manifestation of operational strategy, production philosophy, and growth vision. Professional equipment manufacturers bring irreplaceable value through:
✓ Process engineering expertise that translates brewing science into optimized physical layouts
✓ Integrated system design that eliminates interface risks and accelerates project delivery
✓ Regulatory compliance knowledge that prevents costly violations and delays
✓ Lifecycle partnership that supports continuous improvement and expansion
The data is clear: well-designed brewery layouts deliver 25-40% higher production efficiency, 15-30% lower operating costs, and 18-24 month faster paths to profitability compared to ad-hoc approaches.
As the craft brewing industry matures and competition intensifies, operational excellence through strategic facility design has become a fundamental requirement for success. Equipment manufacturers who combine technical capability, project experience, and long-term commitment provide the foundation for breweries to achieve their production goals, quality standards, and financial objectives.