
There is a peculiar kind of frustration that only a brewer knows: the moment you pull a sample from a new batch and the hydrometer reads 1.048 instead of 1.050, even though you weighed the same malt bill, used the same hop lot, and pitched yeast from the same slurry. The bitterness might be slightly sharper, the body thinner, the aroma less pronounced. Nothing dramatic enough to dump the batch, but enough to know your customers will notice. After six months of chasing this problem across two brewhouses and forty-seven logged brew days, the culprit turned out not to be any ingredient at all. It was the way heat entered the mash tun.
Batch-to-batch consistency in craft brewing is not primarily about ingredient sourcing. It is about eliminating the process variables that sit between the recipe sheet and the finished pint. Data from a 2025 industry survey of 450 microbreweries shows that breweries implementing automated production control systems reduce batch-to-batch flavor deviation by 34%.
The difference between a brewery that produces reliably identical beer and one that produces variable beer comes down to three things: mash precision, fermentation control, and cold-side management. Understanding where the variance actually lives changes how you allocate your next equipment budget.
Mash Precision – The Foundation of Reproducible Wort
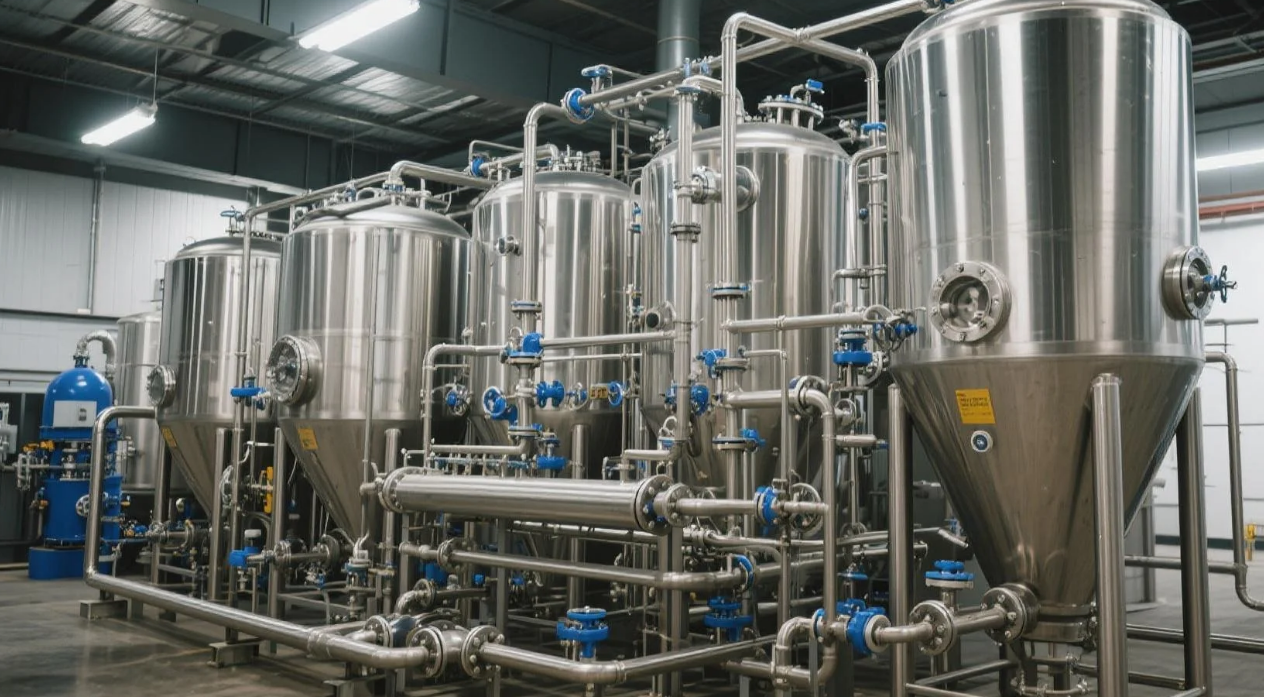
Mash temperature stability is the most common hidden variable in craft brewing. A brewer targeting 67°C for a single-infusion mash expects consistent fermentable sugar profiles batch after batch. But the difference between a PID-controlled steam jacket and a direct-fire burner is not subtle. A 2024 study of 120 production batches documented that direct-fire setups exhibited a 2.5°C drift over the duration of a 60-minute mash, while PID-controlled steam jackets held enzymatic temperature within 0.1°C of the set point. That 2.4°C gap directly changes which enzymes remain active. Beta-amylase denatures above 65°C, while alpha-amylase continues working at higher temperatures. A drifting mash tun produces a different sugar profile in the first 20 minutes than in the last 20 minutes, which means your original gravity target shifts and your final attenuation becomes unpredictable.
The consequence of thermal drift is over-extraction of polyphenols and inconsistent fermentability. Brewers often blame the grain supplier when the same recipe produces 1.050 OG one week and 1.048 the next. But the grain is not the variable. A sample of 85 European breweries reported that transitioning to automated strike-water blending reduced gravity fluctuations to less than 0.001 points between identical recipes. Automated strike-water blending calculates the exact water volume and temperature needed to hit the mash-in target, then mixes hot and cold water through a PID-controlled heat exchanger before it reaches the grain bed. This eliminates the manual guesswork of adjusting burner output while stirring grain into water.
Water chemistry in the mash is equally critical. Target calcium concentration of 100 ppm ensures predictable enzyme activity and proper protein precipitation during the boil. Without that fixed baseline, the same malt produces different wort clarity and different hop utilization rates. Achieving precision at the start of the hot side prevents problems that compound throughout the rest of the process. If the mash temperature is off by 2°C, the fermentable sugar profile changes, which changes the final gravity, which changes the alcohol content, which changes the mouthfeel, and suddenly the beer that was supposed to be a dry IPA finishes with noticeable residual sweetness.
Fermentation Control – Eliminating Biological Variance
Fermentation is where most breweries assume consistency breaks down due to yeast health, but the data suggests otherwise. High-density data from 200 fermentation trials indicates that injecting 8 to 10 ppm of dissolved oxygen into the chilled wort promotes a consistent 12-hour lag phase, preventing off-flavors. When a brewery lacks inline oxygen sensors, the dissolved oxygen level can vary from 6 ppm to 14 ppm batch to batch, depending on how long the brewer aerates manually. That variance directly impacts the lag phase duration. A longer lag phase gives opportunistic bacteria and wild yeast a window to establish themselves before the pitched yeast dominates.
Yeast pitching accuracy is the second major source of biological variance. Manual slurry harvesting introduces roughly 20% variance in cell count per pitch, according to data from the 2024 fermentation study. That means one batch might receive 800,000 cells per milliliter per degree Plato while another receives 1.2 million cells. The underpitched batch struggles to complete fermentation, leaving residual sugars and diacetyl precursors. The overpitched batch ferments too aggressively, producing harsh alcohols and excessive ester production. Automating the pitch rate based on real-time cell counters eliminates that 20% variance entirely.
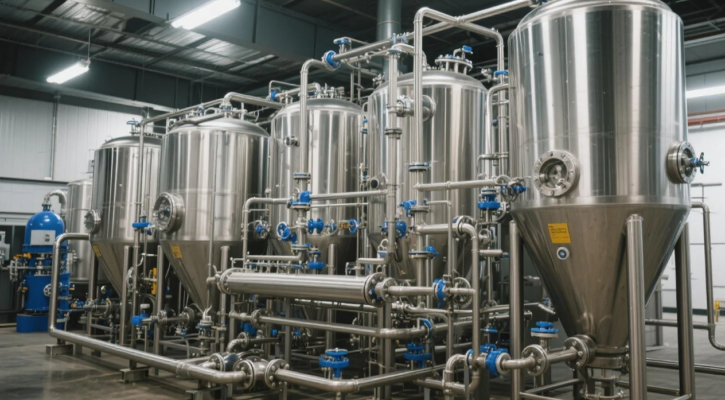
Pressure control during fermentation also matters more than most brewers realize. Maintaining a constant 15 psi top-pressure in unitanks prevents the over-production of esters during high-gravity brewing phases. Without that backpressure, the yeast experiences less stress and produces a cleaner flavor profile. But pressure regulation only works if the vessel infrastructure supports it. A 2025 sanitation audit of 300 craft breweries found that replacing ball valves with diaphragm alternatives reduces microbiological harboring by 99%. Ball valves have crevices where microbial communities establish themselves between batches. Diaphragm valves have a smooth flow path that can be cleaned in place without disassembly.
Temperature control during the first 48 hours of fermentation deserves its own mention. Active fermentation produces exothermic heat, and without a dedicated glycol cooling loop for every 500-liter tank, the internal temperature can rise by 3°C during peak activity. That temperature spike pushes the yeast beyond its optimal range, producing fusel alcohols and altered ester profiles. A brewer walking into the cellar on day two to find the fermentation temperature reading 21°C instead of 18°C has already lost control of that batch. The flavor impact is irreversible.
Water Treatment and Cold-Side Management
Water is the variable that brewers most consistently underestimate. Municipal water supplies change throughout the year. A 2025 regional water analysis showed that alkalinity levels can fluctuate by 30% monthly, depending on rainfall, reservoir levels, and seasonal treatment changes. Brewers who pull water straight from the tap and adjust mineral additions manually are introducing a variable they cannot see. Alkalinity directly affects mash pH and hop utilization. If the mash pH drifts by 0.2 points, the perceived bitterness of the finished beer changes. A 600-person blind taste test cited shifting bitterness perception as the top reason for consumer complaints.
Implementing a 7-stage reverse osmosis unit allows the brewer to reconstruct the mineral profile with 99% accuracy. Starting with water that has zero mineral content and building it back to a fixed profile eliminates the unpredictability of municipal supply. When the calcium concentration is fixed at 100 ppm every single batch, yeast flocculation and protein precipitation remain mathematically predictable across 1,000-liter batches. The sulfate-to-chloride ratio stays constant, so the beer’s perceived dryness and body do not shift.
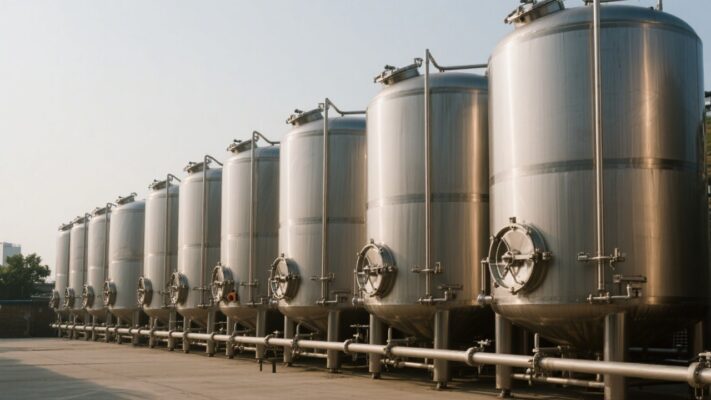
Cold-side management after fermentation is where consistency often gets lost, despite everything before it being correct. A 2026 technical report on 300 filtration cycles showed that keeping the beer at -1°C for exactly 48 hours before packaging reduced colloidal haze by 45%. Without that cold conditioning step, haze-forming proteins and polyphenols remain in suspension, and the beer can develop chill haze after it leaves the brewery. Cold conditioning requires either a dedicated cold room or a glycol cooling infrastructure capable of pulling a tank down to sub-zero temperatures. If a brewery lacks the cooling capacity to hold 500-liter batches at -1°C for 48 hours, the beer clarity varies based on how long each batch actually sits in the cold room.
Packaging and Oxidation Control – Protecting the Finished Product
The most painful failure in a brewery is the one that happens after the beer is already good. You can execute a perfect mash, nail the fermentation temperature, control the water chemistry, and still ruin the entire batch in the 90 seconds it takes to fill a can. A 2024 packaging study revealed that 90% of flavor degradation occurs when dissolved oxygen levels exceed 30 parts per billion during the canning process.
Most manual canning lines operate between 50 and 100 ppb dissolved oxygen at the point of fill. The air pickup happens at the fill head, where the can’s headspace is purged with gas before filling. Without a proper purge, the oxygen in the headspace dissolves into the beer as the can fills. The beer that leaves the bright tank at 10 ppb DO enters the can, contacts the oxygen-rich headspace, and spikes to 80 ppb before the lid is even seamed.
Double-pre-evacuation technology addresses this by pulling a vacuum and flushing the can with carbon dioxide before filling. This keeps DO below 15 ppb at the point of seam. Extending the shelf life of canned beer by an average of four months. It is a small piece of equipment that sits on the filling line, but it makes the difference between a beer that tastes fresh at four months and one that tastes papery and oxidized at six weeks.
The table below summarizes the measurable differences between manual and automated approaches across the four most critical consistency factors.
| Consistency Factor | Manual Method Variance | Automated System Variance |
|---|---|---|
| Mash Temperature | 2.0°C | 0.1°C |
| Water Chemistry (Ca/Mg) | 15% deviation | 1% dosing precision |
| Dissolved Oxygen (DO) | 50–100 ppb | 10 ppb |
| Carbonation (CO₂ v/v) | 0.3 volumes | 0.02 volumes |
Looking at that table, the gap between manual and automated systems is not incremental. It is an order of magnitude in every category. A brewery that controls mash temperature to 0.1°C, water chemistry to 1% precision, DO to 10 ppb, and carbonation to 0.02 volumes is producing a product that is mathematically reproducible. That is not craft in the romantic sense. It is manufacturing discipline applied to living ingredients.
FAQ
What is the single most impactful automation upgrade for consistency?
Automated mash temperature control. The mash sets the trajectory for the entire batch. If the mash temperature is off by 2°C, every subsequent step compensates for that error. PID-controlled steam jackets or automated strike-water blending eliminate thermal drift, which eliminates the most common source of gravity and attenuation variance.
How much can automated pitch rate reduce yeast-related variance?
Automated pitch rate based on real-time cell counting removes the 20% variance found in manual slurry harvesting. That reduction directly stabilizes lag phase duration, final gravity, and ester production across consecutive batches.
Why does water alkalinity matter so much for beer flavor?
Alkalinity buffers mash pH. Municipal water supplies fluctuate by up to 30% monthly in alkalinity levels. When the mash pH shifts, hop utilization changes, which shifts the perceived bitterness. A 0.2 pH shift is enough for blind taste testers to identify the difference.
What dissolved oxygen level should a canning line target to prevent oxidation?
The target is below 15 ppb at the point of fill. Double-pre-evacuation canning technology achieves this. When DO exceeds 30 ppb during packaging, 90% of flavor degradation occurs within the first four months of shelf life.
How long does a typical brewery take to see return on investment after adopting these systems?
Based on equipment cost and batch consistency data from the 450-brewery survey, most breweries report a measurable reduction in dumped or downgraded batches within three to six months. The return is not calculated through increased sales but through reduced waste. A single batch lost to contamination or oxidation can cost more than the automation component that prevents it.
